Construction Analytics Software for Field Data
Turn labor, equipment, production, and job cost data into decisions your team can act on.
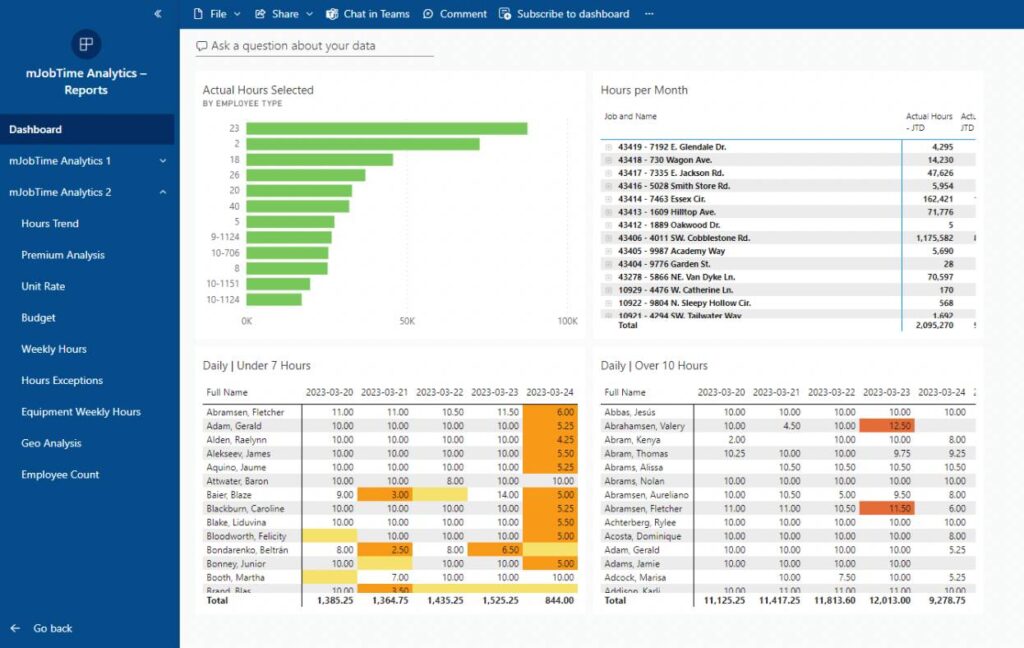
mJob gives contractors construction data analytics software that turns field activity into real-time project visibility. Powered by Microsoft Power BI, our construction analytics software helps you monitor labor productivity, equipment utilization, production trends, budget activity, and project profitability without waiting for month-end reports.

Real-Time Construction Project Dashboards
Visualize project health at a glance with dashboards built around the data contractors care about most. mJob helps project managers track labor hours, budget burn rates, overtime trends, equipment usage, and field productivity from one reporting view.
- ✓Labor Productivity: Compare estimated vs. actual hours by job, employee, crew, or cost code to identify productivity issues early.
- ✓Overtime Visibility: Spot overtime spikes and labor cost trends before they damage project margin.
- ✓Drill-Down Reporting: Click from company-level analytics into job, cost code, employee, equipment, or time card details.
Custom Construction Reporting and Business Analytics
Every contractor measures performance differently. With mJob and Microsoft Power BI, you can build construction business analytics around the KPIs that matter to your operation, including labor performance, equipment utilization, production quantities, job costs, overtime, and project trends.
Filter analytics by job, cost code, union local, crew, equipment type, employee, or date range to get the answers your project teams and executives need.

Drag-and-drop reporting for construction KPIs and project performance.
Construction Cost Analytics for Better Project Decisions
Stop bidding and managing work with outdated information. mJob helps contractors use historical production data, labor hours, equipment usage, and cost activity to understand what work really costs and where margins are being won or lost.
With construction analytics connected to field data, your team can compare estimates to actuals, review production rates, identify cost trends, and make more informed decisions before small issues become expensive problems.
For a complete reporting workflow, connect analytics with your construction reporting software, construction daily logs, and construction cost tracking tools.

Bid smarter with accurate historical production and cost data.