Construction Analytics & Business Intelligence
Turn Field Data into Revenue.
Don't just collect data—use it to win. mJob’s Construction Analytics suite, powered by Microsoft Power BI, gives you a real-time window into labor productivity, equipment utilization, and project profitability. Stop waiting for month-end reports to know if you're making money.

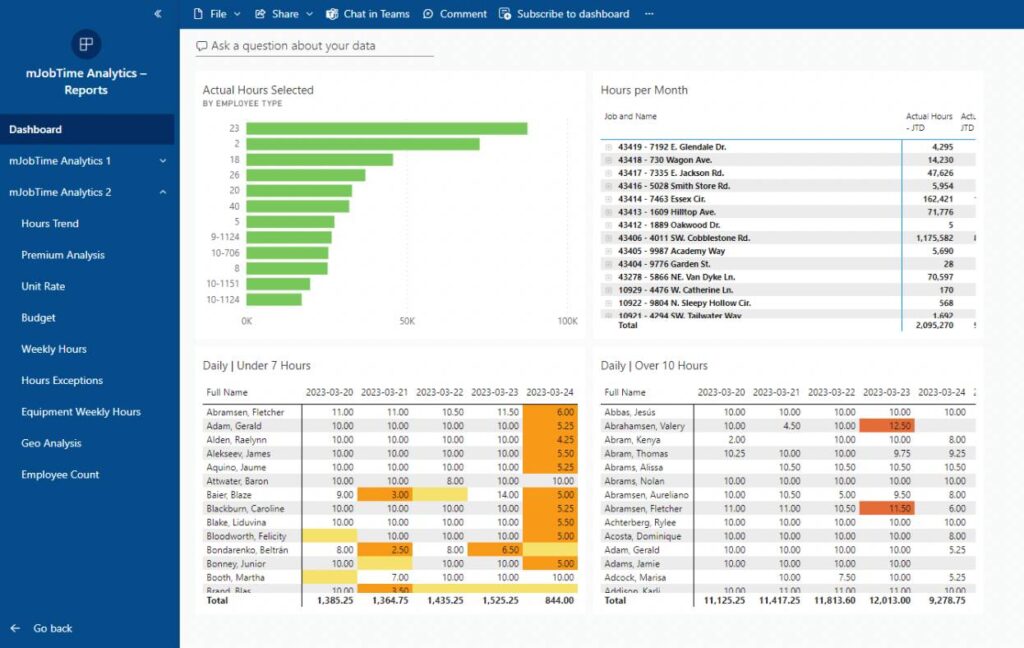
Real-Time Project Dashboards
Visualize your project health at a glance. Our pre-built dashboards allow Project Managers to track labor hours, budget burn rates, and overtime trends instantly.
- ✓Labor Productivity: Compare estimated vs. actual hours by cost code to identify underperforming crews.
- ✓Overtime Alerts: Spot overtime spikes before they destroy your project margin.
- ✓Drill-Down Capability: Click on any chart to drill down from the company level to a specific employee's time card.
Custom Construction Reporting
Every contractor measures success differently. With our Custom Report Builder, you can design reports that match your exact KPIs. Filter by job, union local, equipment type, or date range to get the answers you need.

Drag-and-drop report customization for any project KPI.
Data-Driven Financial Decisions
Stop bidding in the dark. Use historical production data from mJob to bid future jobs more accurately. Knowing your true production rates allows you to tighten your estimates and win more profitable work.
Eliminate the reliance on gut feelings and base your strategy on forensic-grade field data captured directly from your jobsites.

Bid smarter with accurate historical production data.